Context Graph
One graph for humans and agents
Shipping a single feature with a coding agent takes seven tools. Each one owns a slice. The connections between slices live in your head. A context graph turns those connections into typed, persistent links that both you and your agent can traverse.
Today
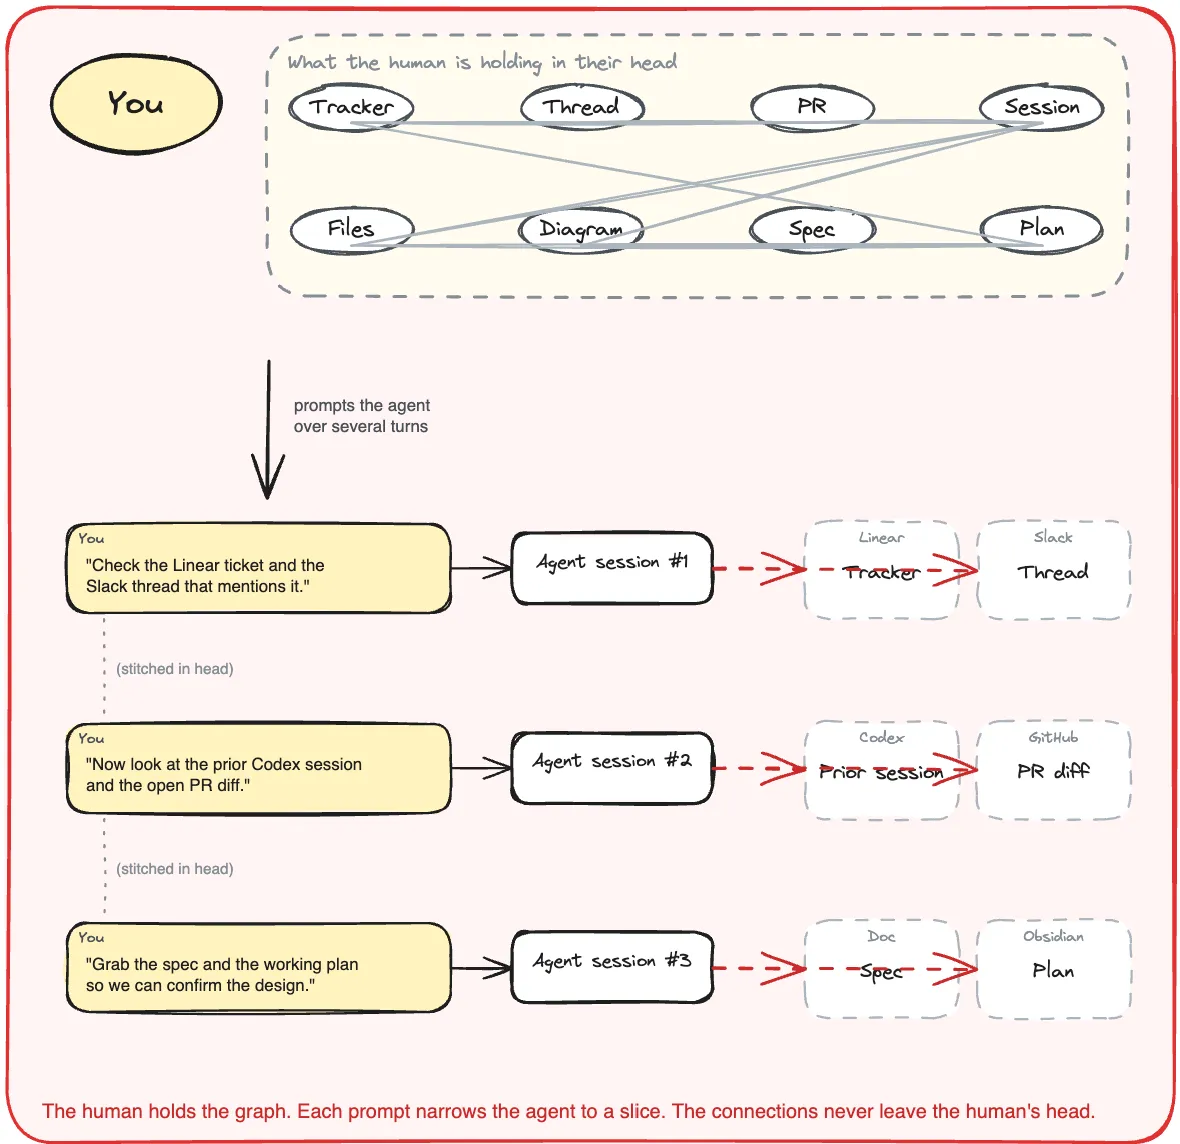
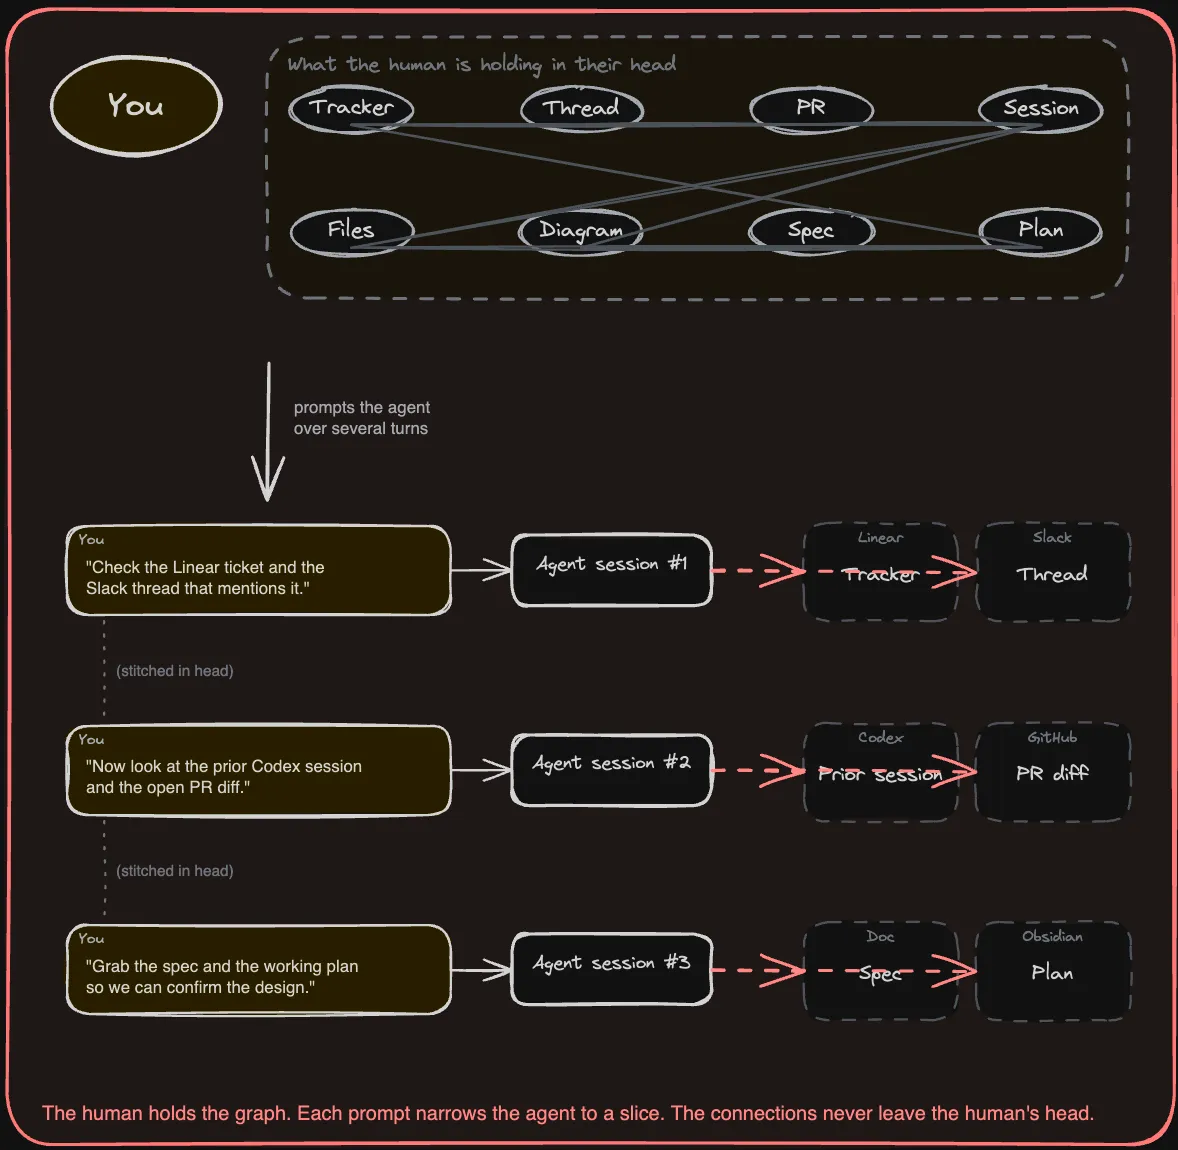
The graph lives in your head
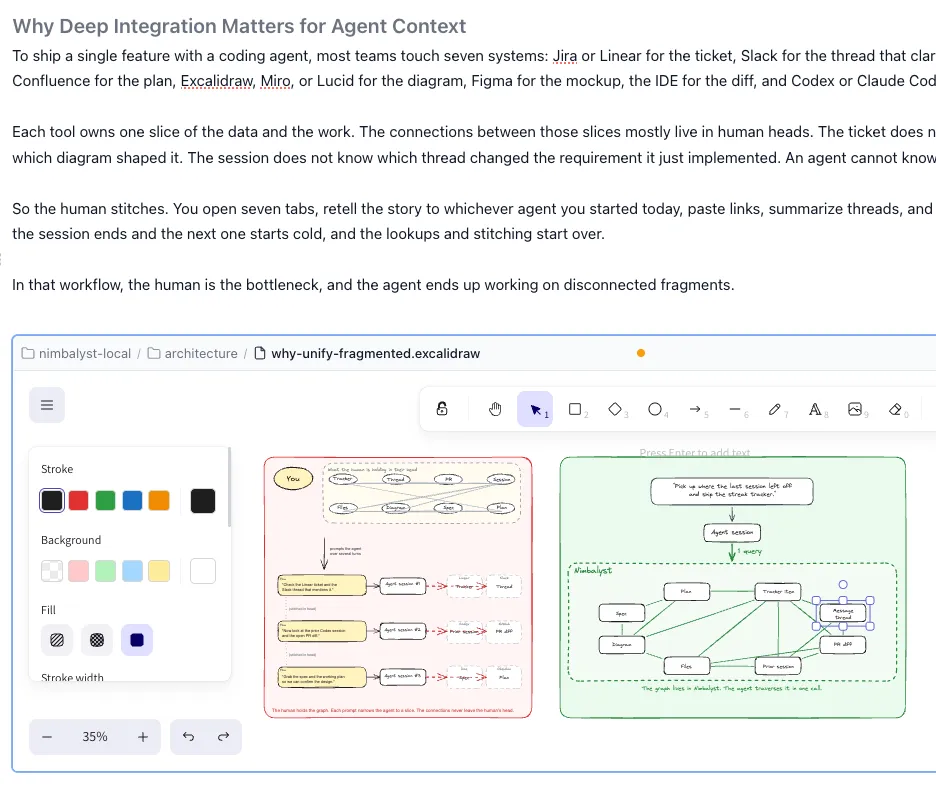
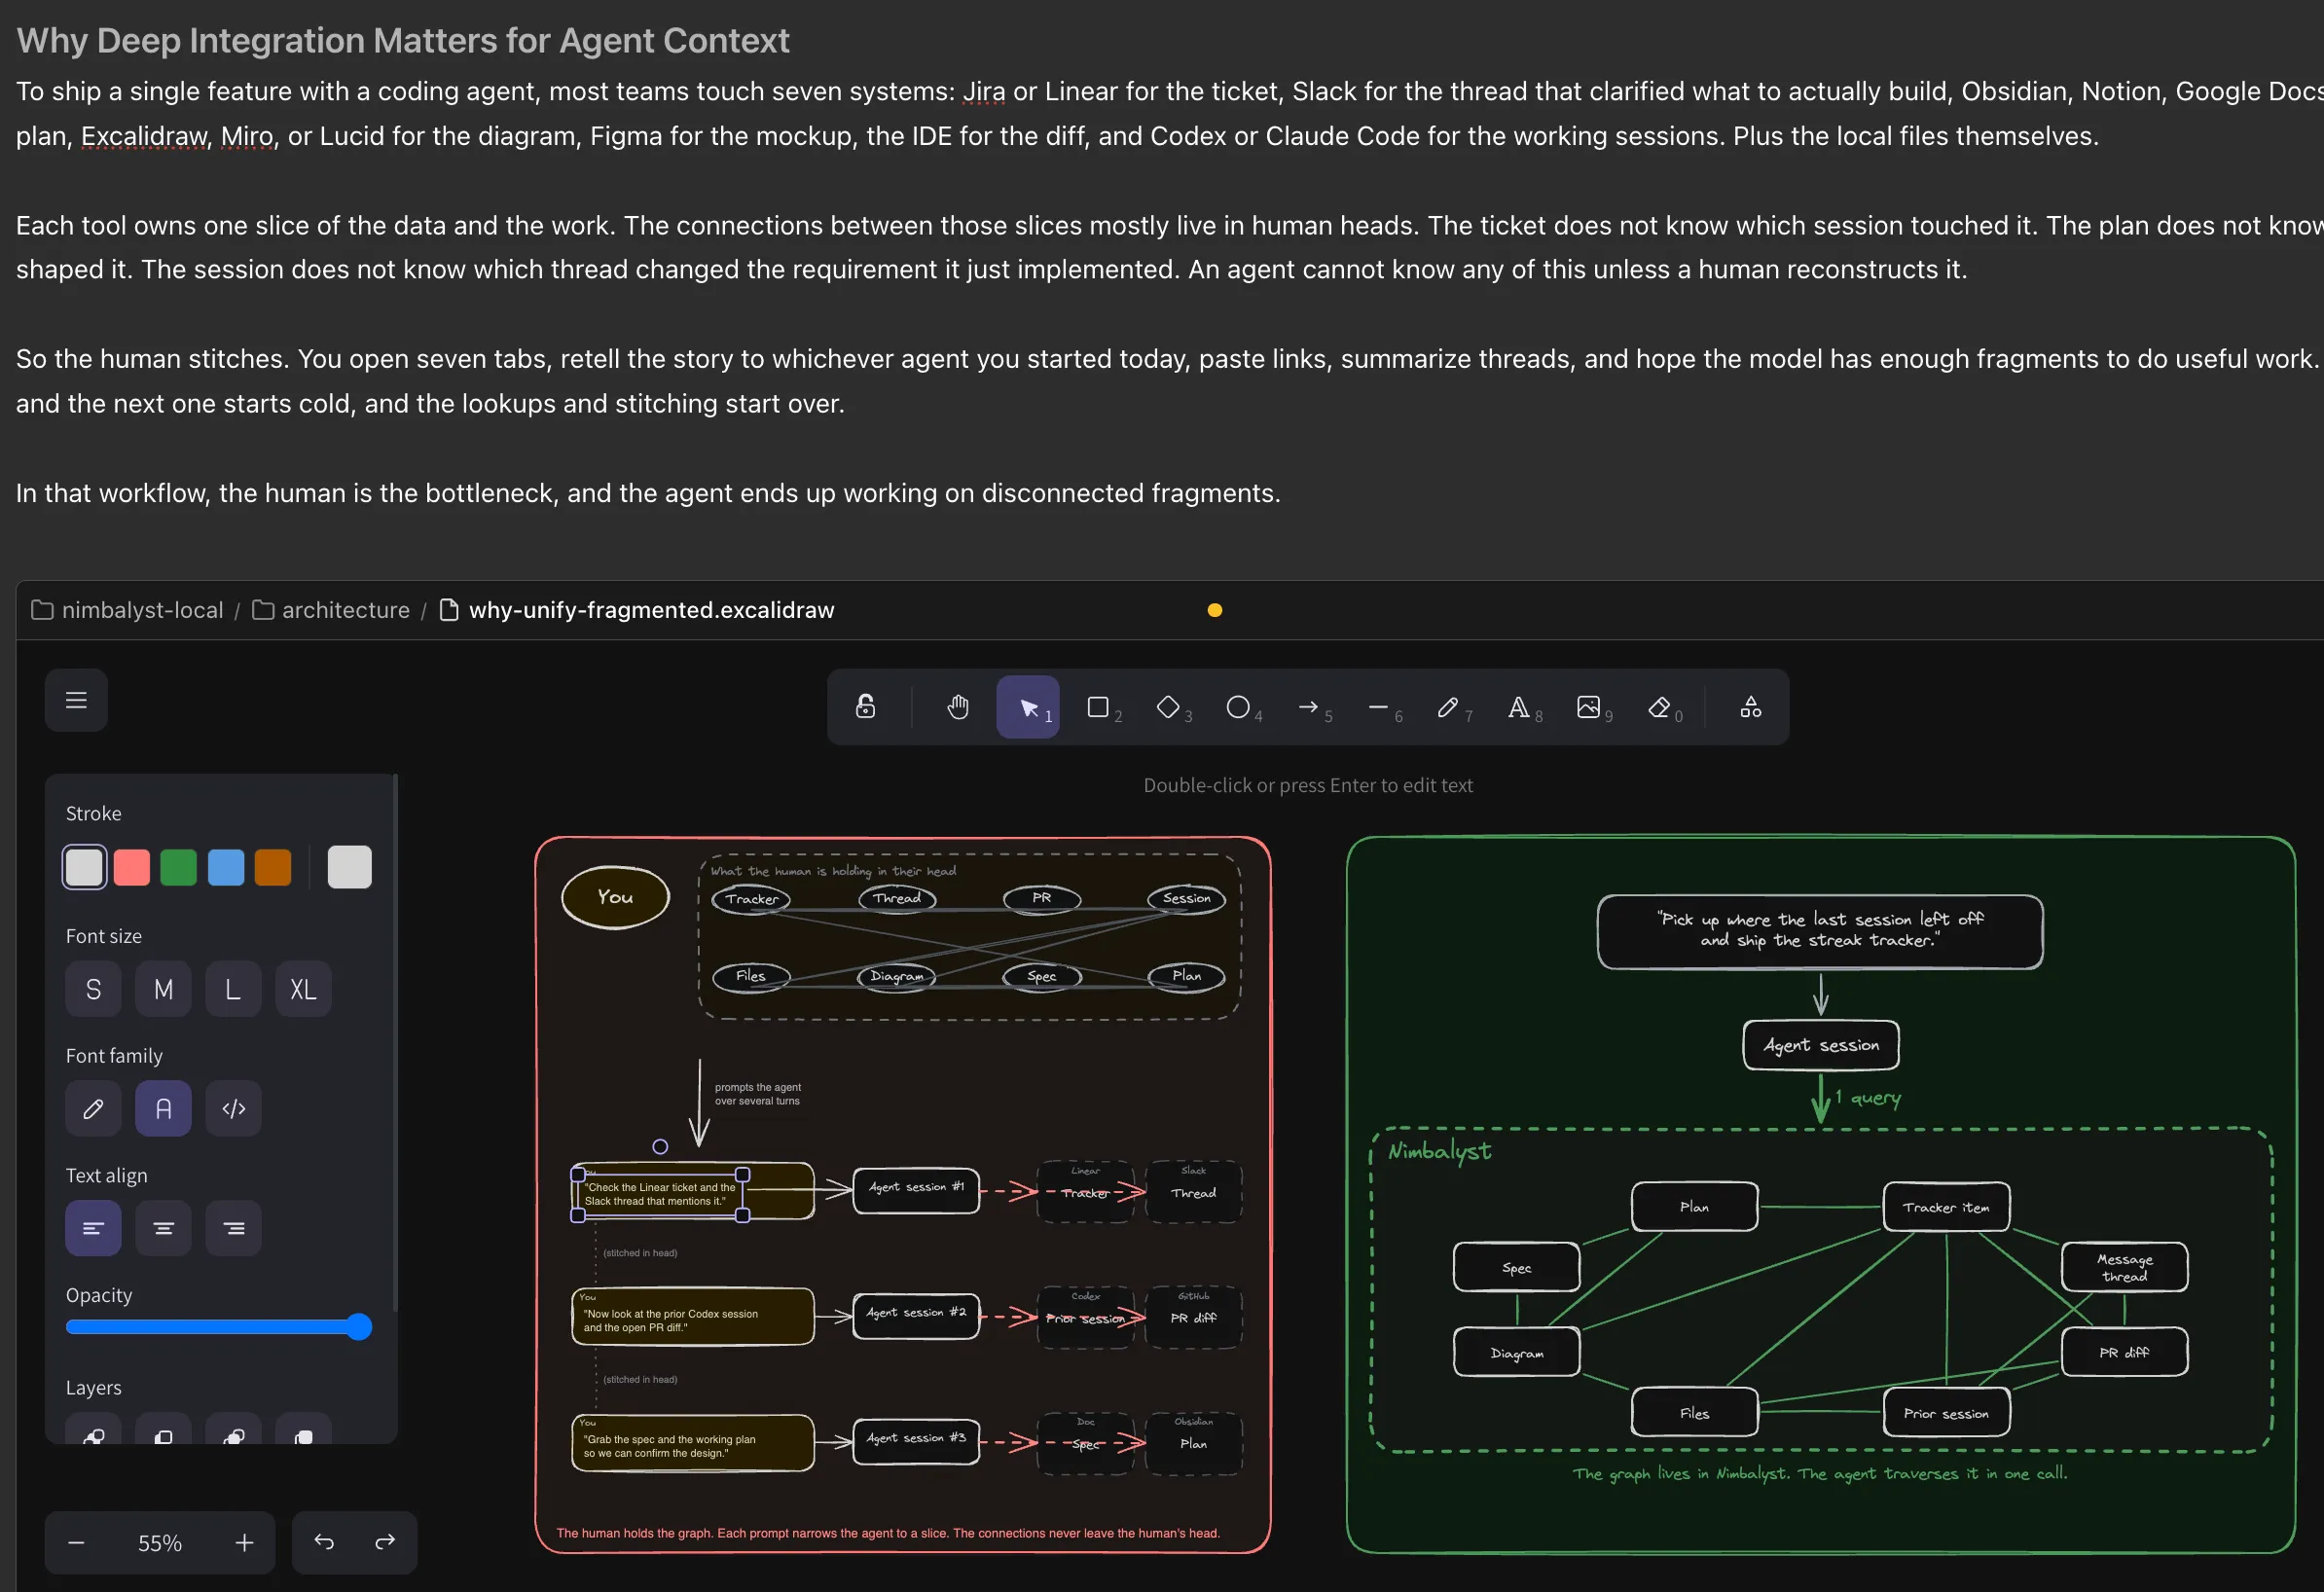
Shipping one feature with a coding agent usually touches seven tools: Jira for the ticket, Slack for the thread, Notion for the plan, Excalidraw for the diagram, Figma for the mockup, the IDE for the diff, and Claude Code for the session.
Each owns one slice. The connections between slices live in human heads. An agent cannot traverse what was never recorded.
A context graph turns those slices into nodes and typed edges that both humans and agents can walk in a single traversal.
What changes
Context integrated into one shared graph
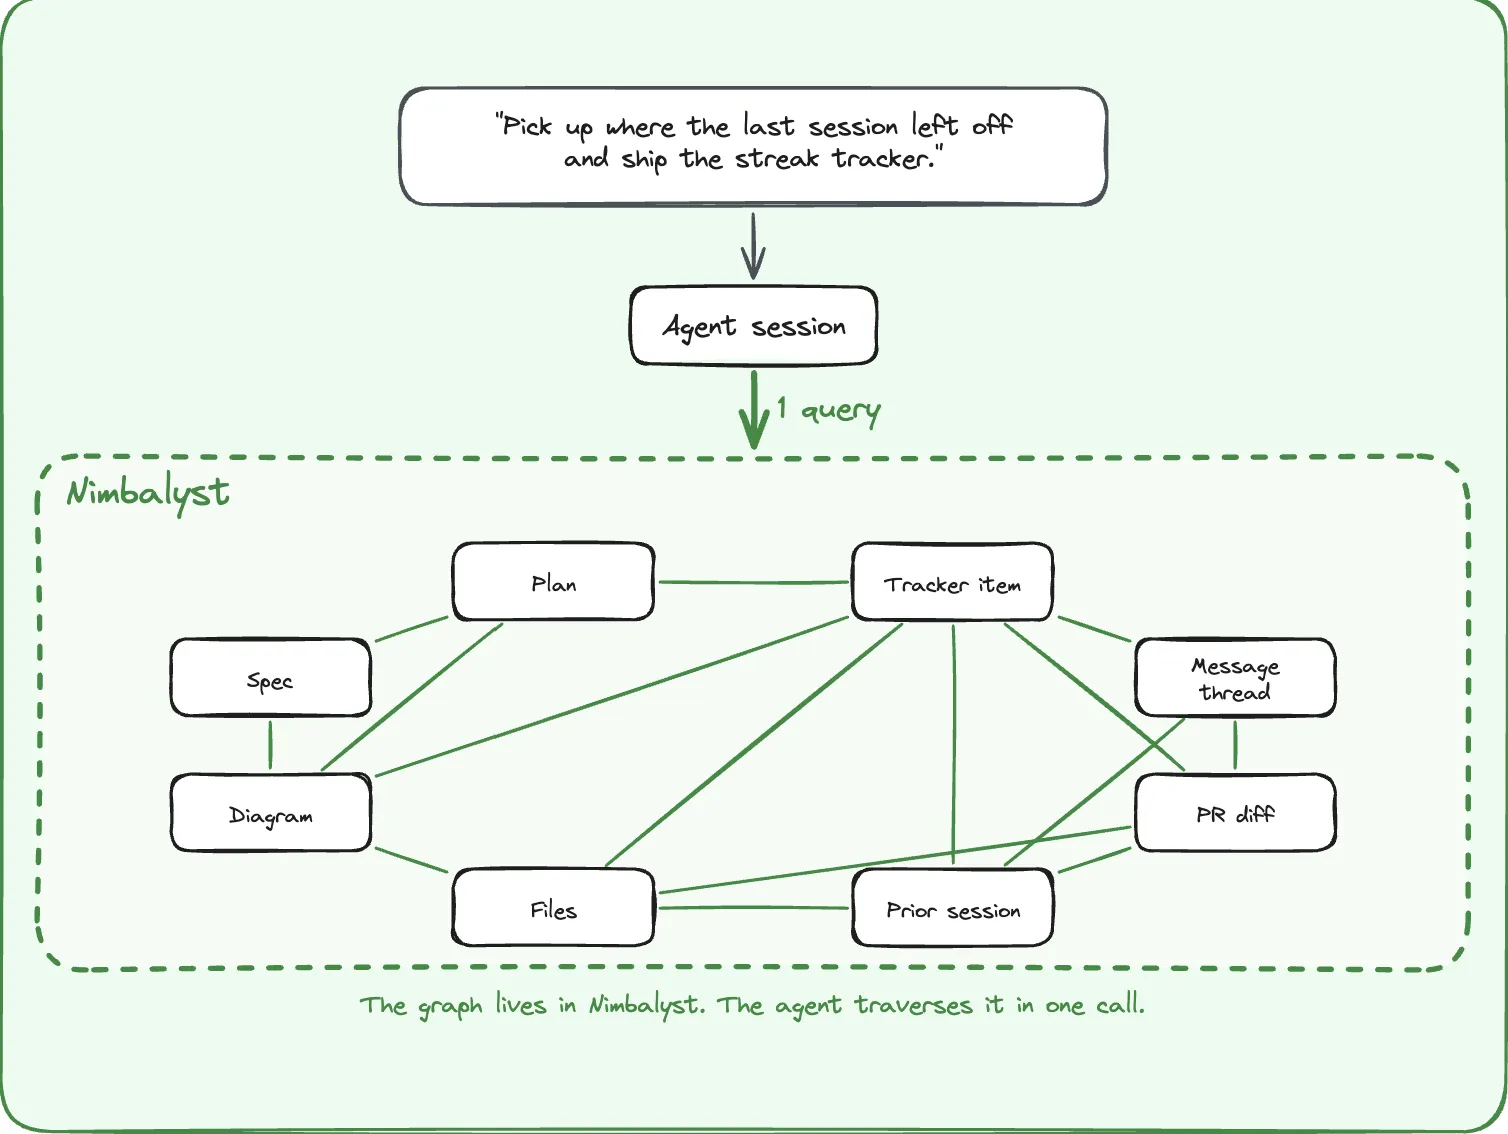
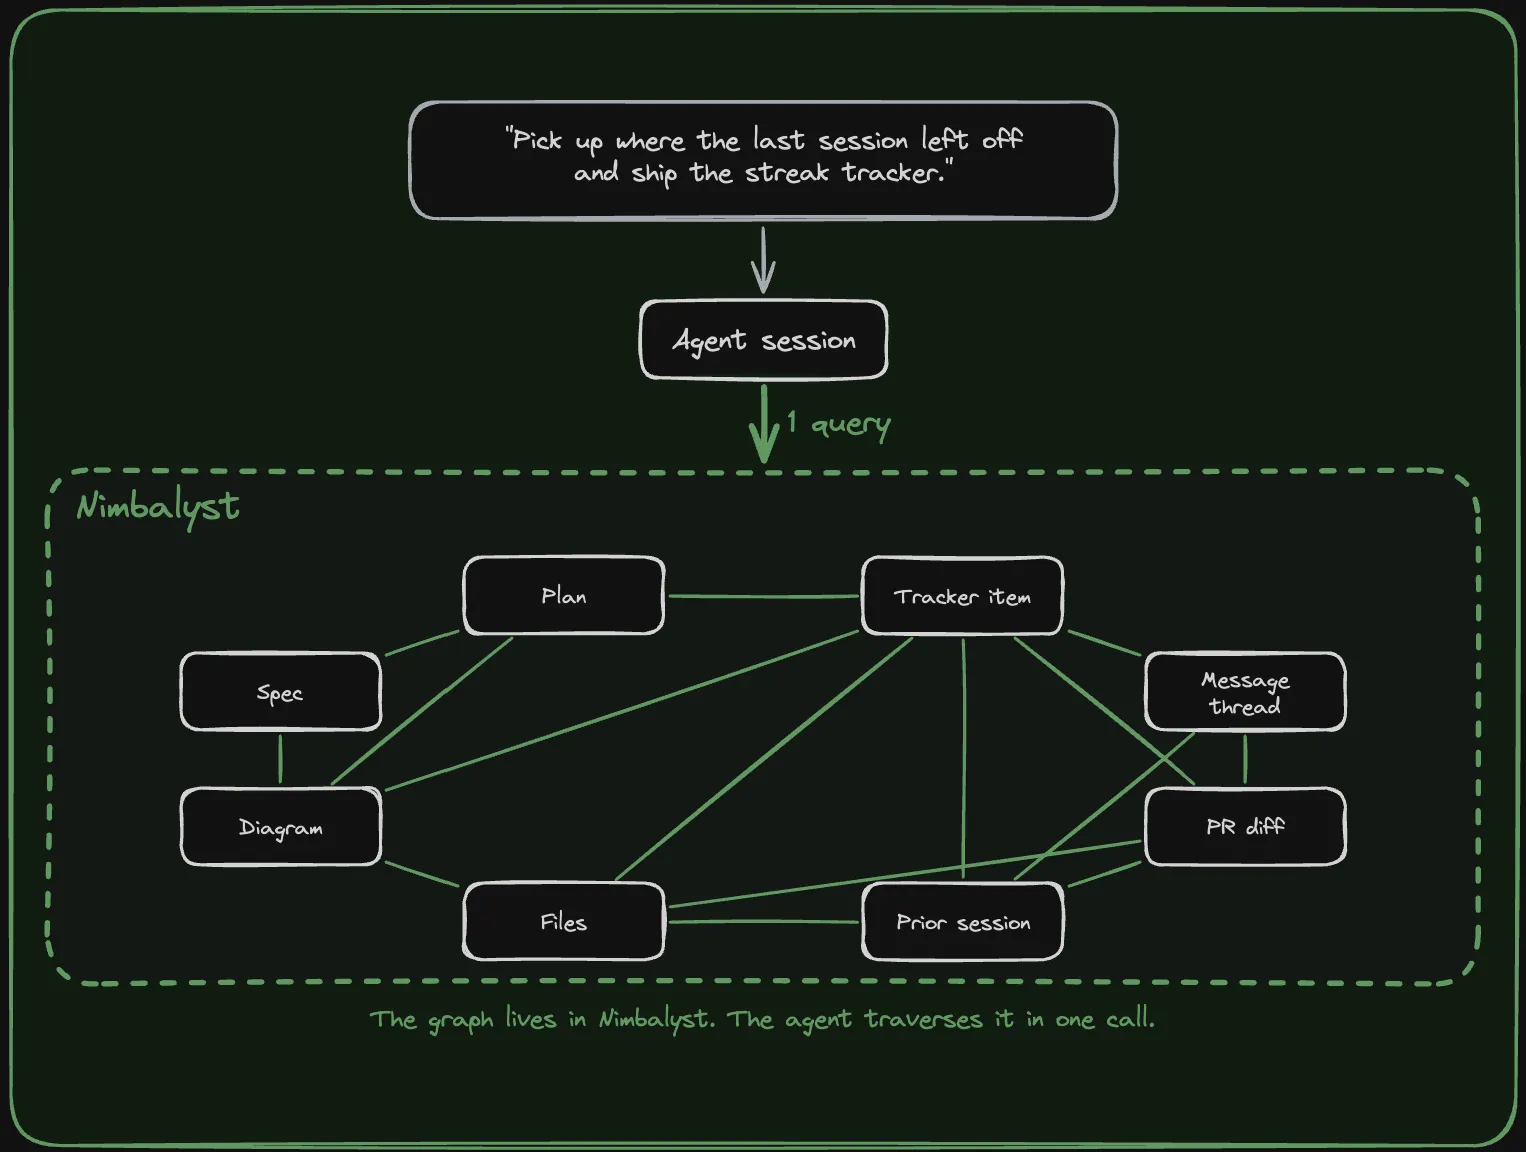
Ask your agent to pick up where the last session left off. Across a fragmented stack, that is a chain of lookups through separate tools and separate data models, and the agent may still not know which prior session touched the work.
In an integrated workspace, every artifact is a node and every relationship is a typed edge. Tracker item to thread to plan to spec to session to diagram to diff to files. That is one traversal in place of seven lookups.
Any agent can plug into it. Claude Code, Codex, OpenCode, or whatever lands next.
The nodes
Every one of these is a first-class artifact in the workspace, and every one can carry typed links to the others. Seven of them map to the tools you already open. The spec, the files, and the commit belong to no single tool, which is why they usually fall out of the picture entirely.
-
Tracker item
Tickets, bugs, decisions, ideas
-
Plan
The plan doc for a piece of work
-
Spec
The markdown spec with embedded diagrams
-
Diagram
Excalidraw, Mermaid, system diagrams
-
Mockup
Rendered UI mockups you can iterate on
-
Thread
The conversation around the work
-
Session
The agent session that worked on it
-
Diff
The red and green changes the agent made
-
Files
The actual files on disk
-
Commit
The commit that landed the change
Visual editors
Edit every node without leaving the graph
A graph of typed edges only works if you can edit what is on the other end without leaving the place you started.
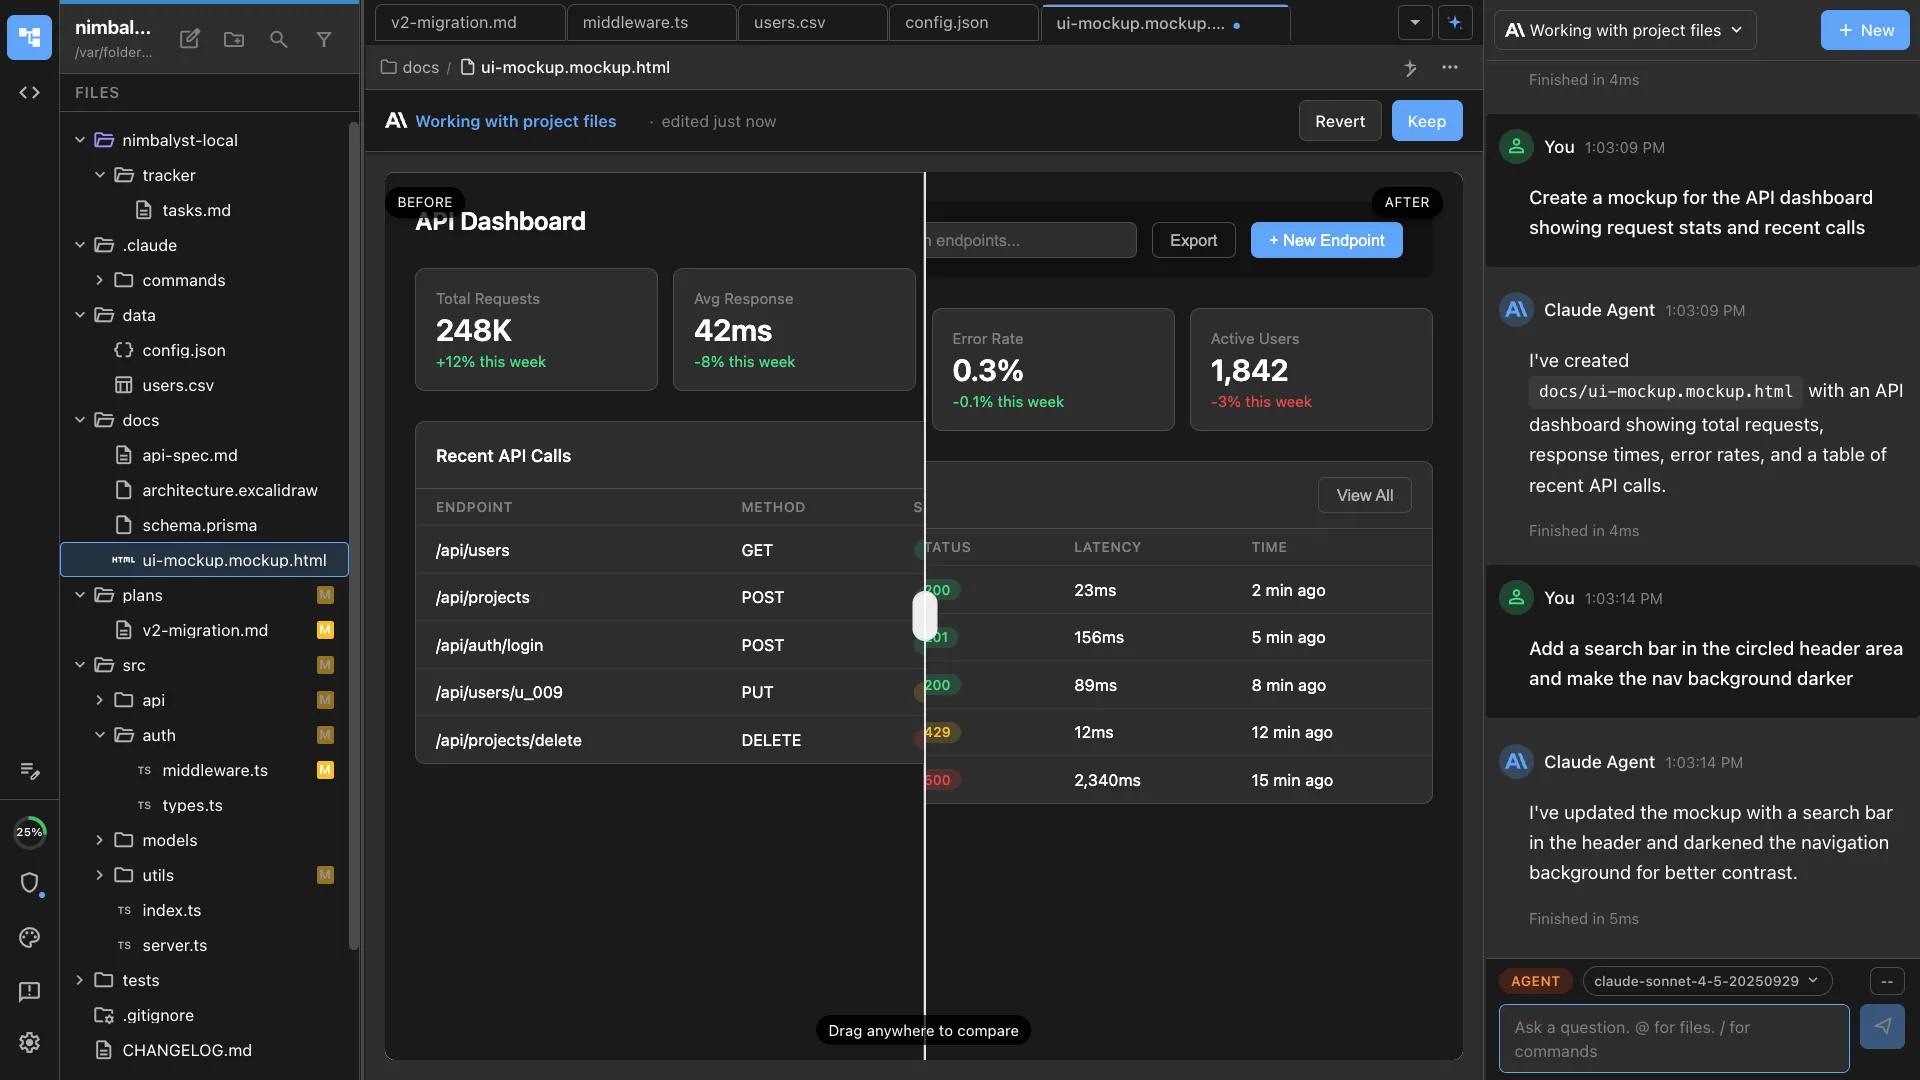
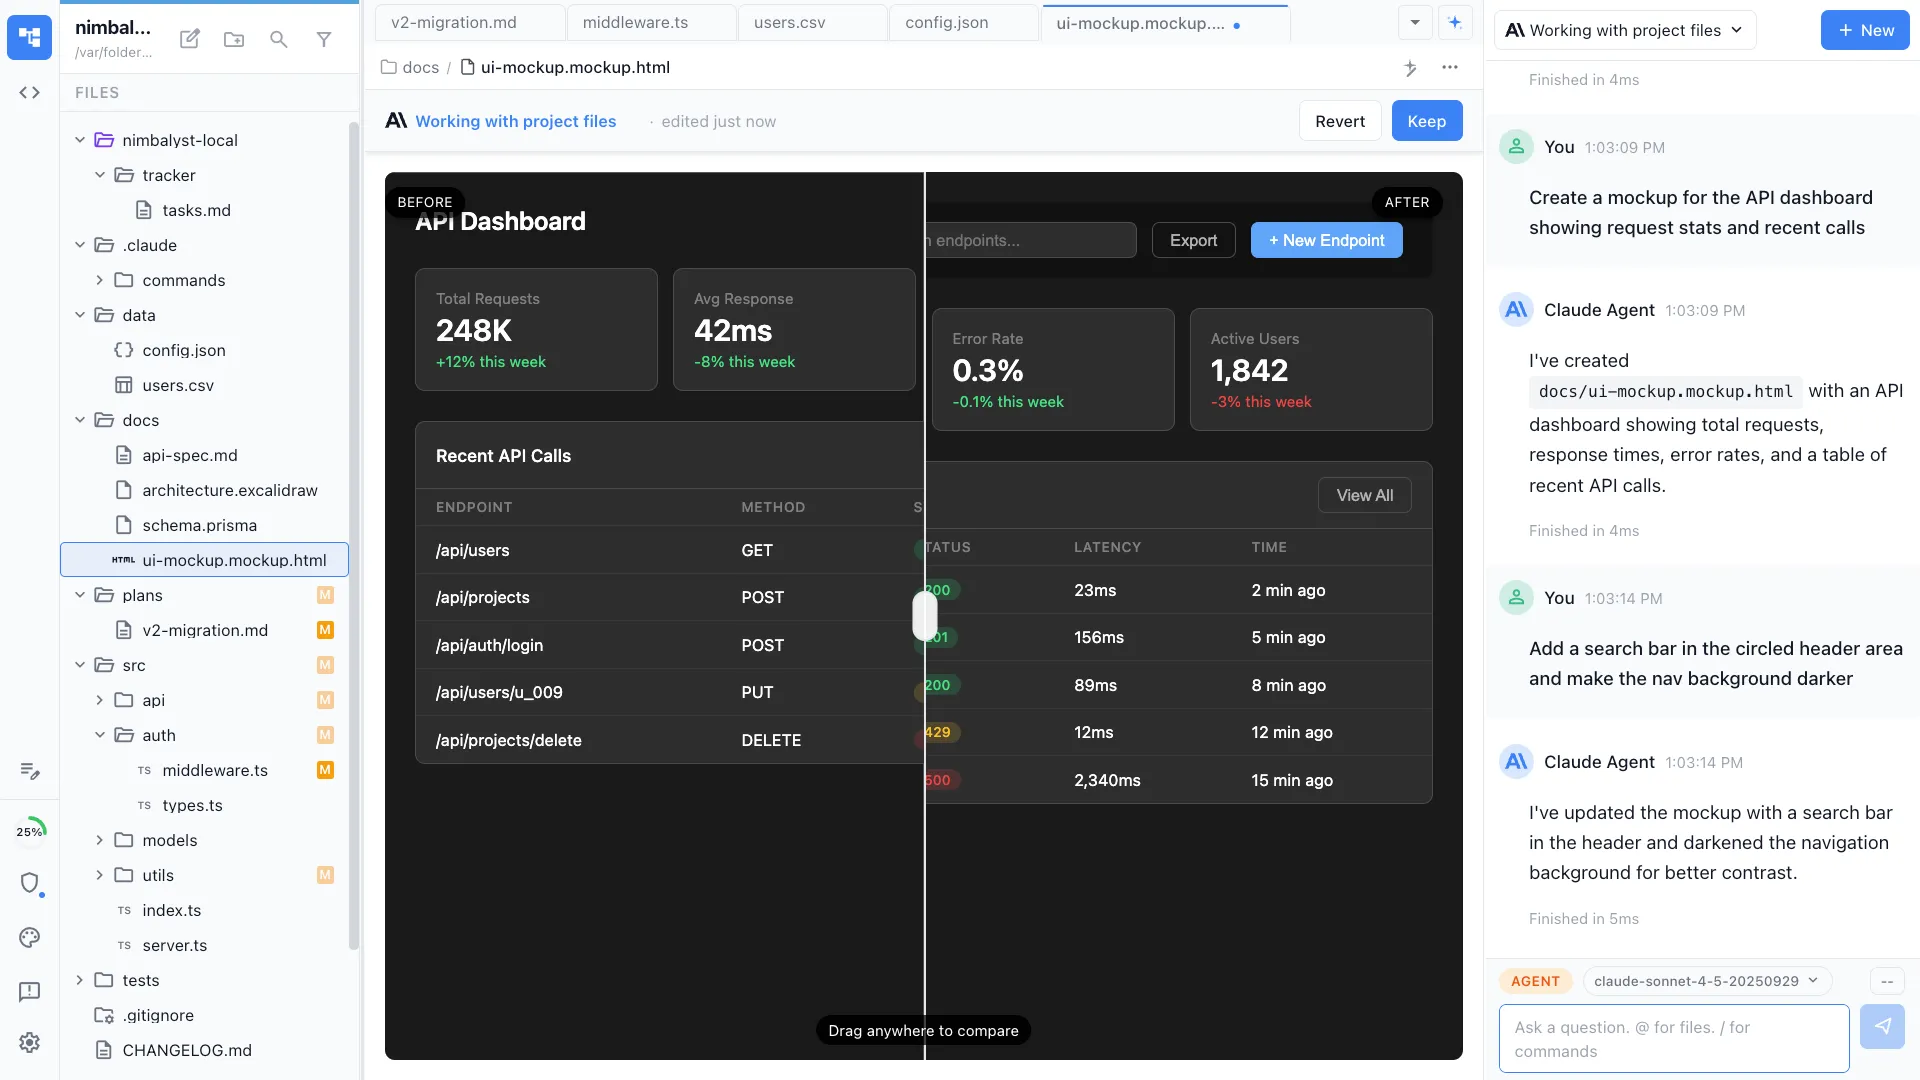
Open the diagram from inside the tracker item. Pull up the mockup without leaving the spec. Click into the embedded diagram and the spec updates.
Agent and human edit the same artifact. Red and green diffs are visible to both. The visual surface and the agent's working surface are the same surface.
The 80%
Build the 80% that matters, integrate into one graph
Deeply integrated agent context will not exist as long as work is scattered across seven SaaS apps.
Nimbalyst builds the 80% of those products that matters and ties them into one graph.
- Tracker for tickets, bugs, decisions, and ideas
- Markdown editor with WYSIWYG and red/green diffs
- Diagrams as first-class files
- Mockups that render
- Code editor
- Sessions that persist
Message threads are next. Conversation around a piece of work is part of the work.
FAQ
Questions about the context graph
What is a context graph?
How is a context graph different from a knowledge graph?
Why does my agent need a context graph?
Can I bolt a context graph onto Jira, Notion, Figma, and Claude Code?
Does the context graph work with Claude Code and Codex?
Is the context graph open and inspectable?
Nimbalyst: the open-source visual workspace for building with Codex, Claude Code, and more
Free for individuals. Works with your existing Claude Code or Codex subscription or API key.
Nimbalyst Teams is multiplayer. Your whole team, Codex, and Claude Code in one shared workspace.