Project Graph
Explore your whole project as one navigable surface. Atlas maps your project's areas, Pulse shows where activity moved over time, and Evidence Trails walks the recorded links between trackers, sessions, commits, and files.
Project Graph indexes the artifacts your project already produces, including AI sessions, tracker items, commits, plans, documents, GitHub issues and pull requests, and project memory, and presents them as one navigable picture. Instead of a single tangled node diagram, it offers three complementary views over the same index: Atlas, Pulse, and Evidence Trails.
Project Graph ships as a built-in extension on the alpha release channel and is off by default. Turn it on under Settings > Application > Installed with the extension's enable toggle. Once enabled, a Project Graph button appears in the navigation gutter on the left.
Opening Project Graph
Click the Project Graph icon in the navigation gutter. The panel opens full screen with a toolbar for switching views, choosing an area, setting the time range, and opening settings.
While your project is being indexed for the first time, you can switch the Data selector from Live project to an illustrative sample of about 3,000 records to explore how the views work. Once indexed, Project Graph keeps a cached copy of your project's records, so on later launches it shows your data immediately and refreshes in the background instead of starting from a blank screen.
The Three Views
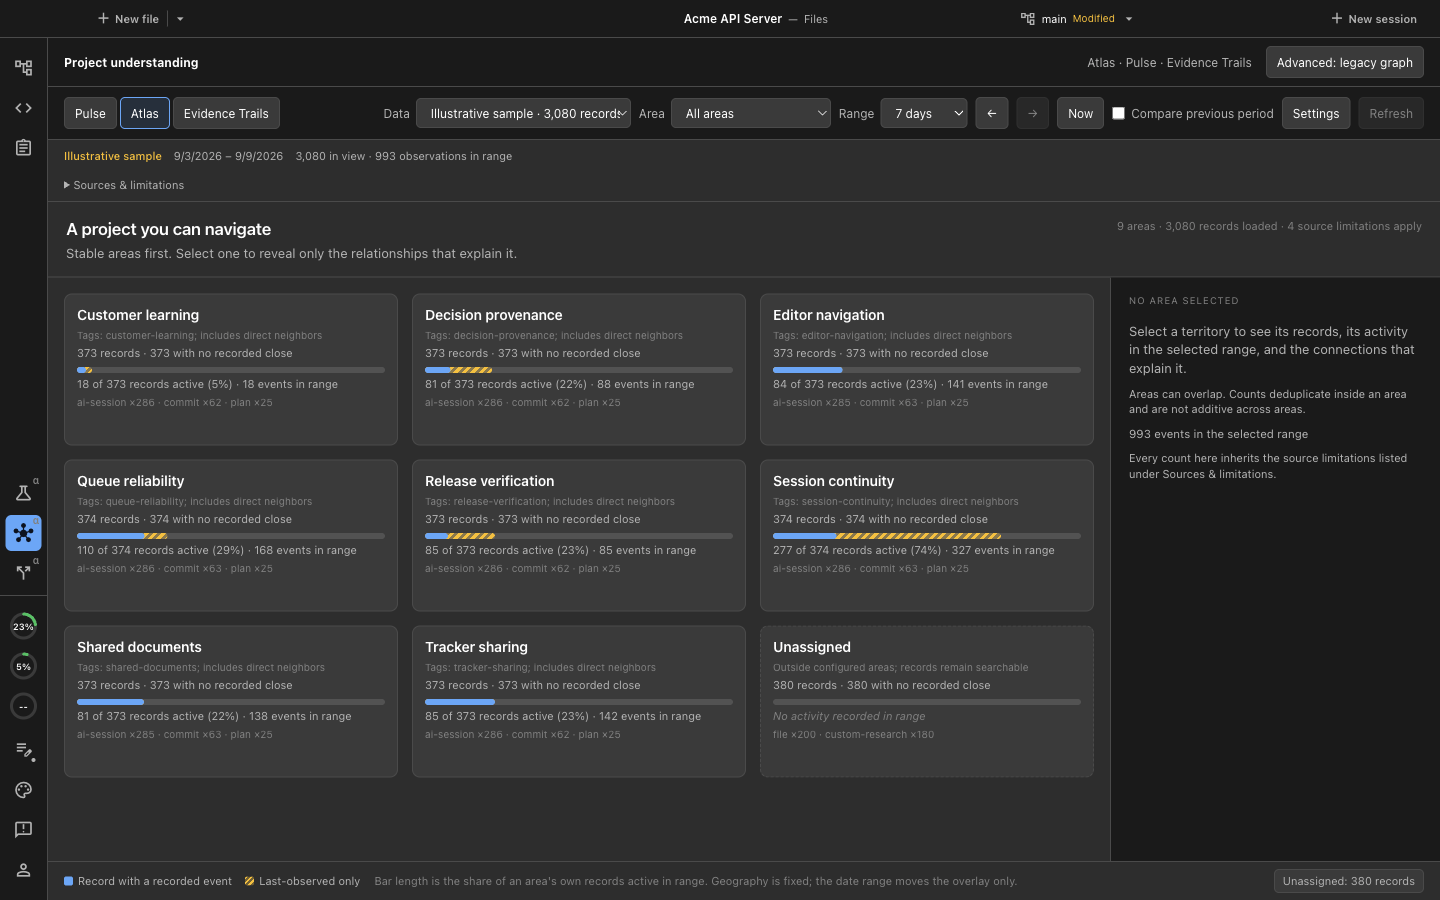
Atlas draws each project area as a tile with its records, activity in range, and the sources that produced them.
Atlas
Atlas is a territory map of your project's areas. Each area is drawn as a tile whose position stays put: changing the date range, renaming an area, or refreshing the index repaints the overlays without rearranging the map, so you build spatial memory of where things live.
Selecting an area opens a detail panel with three tabs:
- Connections: how this area relates to others. Recorded links (a tracker item linked to a session, a commit touching a file) are shown separately from links that merely come from files sitting in the same directory, and each drawn connector names the relation that produced it.
- Activity: what happened in the area during the current time range.
- Records: the artifacts inside the area, with every list stating how many of the total it is showing.
Pulse
Pulse answers "what changed recently, and where did attention move?" It is a grid: rows are areas (or the individual artifacts inside one selected area), columns are calendar buckets by day, week, or month, and each cell counts the distinct artifacts with recorded activity in that bucket. Rows sort by most recent activity, most events, or name.
Pulse is deliberately conservative about what a cell means. An empty cell means no events were loaded for that bucket, which is not evidence that nothing happened, and buckets outside the loaded history are marked as such rather than shown as quiet. Turn on Compare previous period in the toolbar to see the current window against the one before it, and click into cells to inspect the underlying events.
Evidence Trails
Evidence Trails answers "why does this record exist, and what does it affect?" You focus one artifact at a time, and its recorded relations are grouped into named lanes: the sessions a tracker item was worked on in, the files a session edited, the files a commit touched, and so on. An inspector explains what in the sources supports each connection, and a relation that only comes from file-path containment is labeled that way and can be collapsed separately, so explicitly recorded links stay visible.
Following a connection moves the focus and builds a breadcrumb trail, so you can walk from a bug to the session that fixed it to the files that changed, and back.
Sources
Project Graph draws on seven sources, each of which can be toggled in settings:
| Source | What it contributes |
|---|---|
| Sessions | AI sessions and the files they edited |
| Trackers | Tracker items and their links to sessions |
| Commits | Git commits and the files they changed |
| Plans | Plan documents |
| Documents | Project documents |
| GitHub | GitHub issues and pull requests |
| Memory | Project memory records |
The Sources & limitations disclosure above the view states exactly what is loaded and what is not, so the picture never silently overstates its coverage. Settings also control whether archived records are included, how far back event history loads (90 days, 1 year, or all available), and an optional per-source safety limit for very large projects.
Areas
Areas are the map's regions. Project Graph proposes an initial set automatically after the first index, and records that no rule claims land in an Unassigned area rather than disappearing. In settings you can add your own area rules by tag, by file path, or by anchoring an area to a specific record, and you can rename any area directly on the map.
Time Range and Comparison
The toolbar sets the window to 7, 30, or 90 days. The arrow buttons step to earlier and later windows, Now returns to the present, and Compare previous period overlays the preceding window of the same length. Narrowing the date range changes what is highlighted, not what is indexed: older context stays available.
Saved Views
Once you have a combination you like (view, time range, area, comparison setting, and hidden record types), save it as a named view from settings. Saved views appear in the Lens dropdown in the toolbar, and a Modified marker shows when your current settings have drifted from the saved definition. You can keep up to 30.
Exploring a Record
Clicking any record opens its source panel with three tabs:
- Record: the record itself, including its current status and its full body, loaded on demand from the source.
- Focused graph: the records connected to this one, paged rather than truncated.
- Recorded history: the events recorded for it, newest first.
From here, Open original jumps to the source artifact: the AI session, the tracker item, or the file in its editor. References to records that were not part of the loaded index can be resolved on demand, and a reference that cannot be found in any available source is reported as unresolved rather than guessed at.
The Legacy Graph
The earlier single-canvas graph view is still available behind the Advanced: legacy graph button at the top of the panel, and Return to project views brings you back to Atlas, Pulse, and Evidence Trails.